Sum estimating
Excerpt: This problem explores the links between integration and summation. Often when introducing integration we use sums to approximate integrals. Here the idea is turned on its head and students are asked to approximate the value of the sum of using integrals.
Warm-up
Can you convince yourself that ?
Suggestion
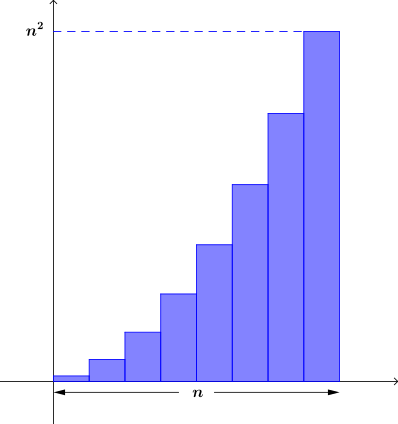
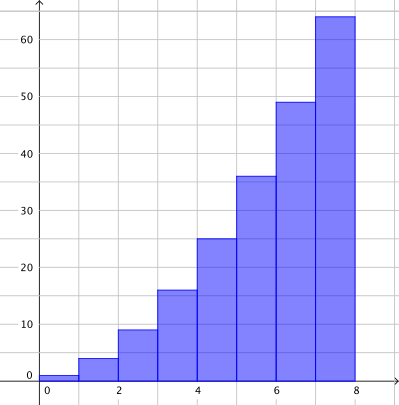
Think about representing the sum of the first square numbers as bars of width and height .
A convincing argument
Written in this form we see that .
We might also have seen this from the diagram above as the last bar has an area of .
When is and when is ?
The second half of the inequality can also be determined from this diagram. The sum of the square numbers is enclosed by a rectangle made up of the axes, the dotted line, and the last bar. This rectangle has an area of and so
Putting this together gives us .
Problem
In the Warm-up we saw that and can be used as lower and upper bounds for the value of :
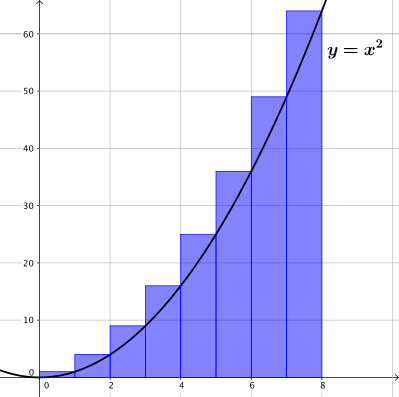
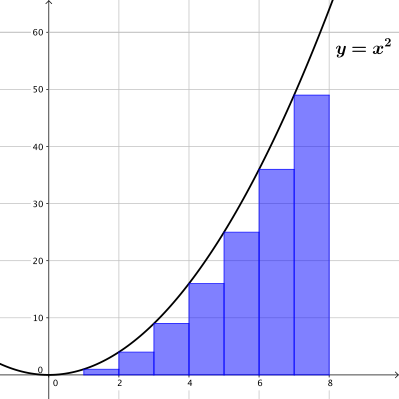
We can use the diagrams below to find a different way to bound .
-
Which of the areas represented in the two diagrams is bigger?
-
Does this result generalise?
Use this information to provide either an upper or lower bound for .
- Can you find a function which bounds the graphical representation of on the other side?
Suggestion
Use this function to provide a second bound for .
Solution
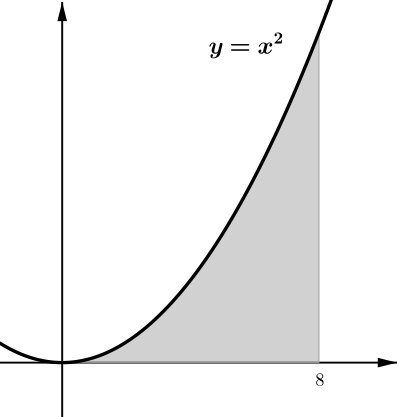
The first diagram is a representation of the sum of the first square numbers, where each bar has width and height . The second diagram has a shaded area which can represented by the integral .
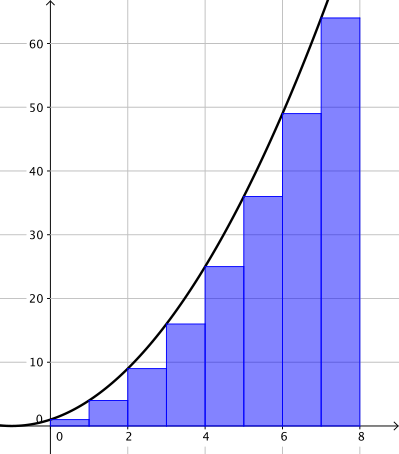
Which of these areas is bigger? We could numerically compute the areas but a simple way to compare them is to draw the two images on the same axes.
We can see that , but we can also generalise this result from the diagram and say that
Use this information to provide either an upper or lower bound for the value of .
Calculating the value of the integral, we have , so we can provide a lower bound for ,
How does what we’ve done here, using an integral to estimate a summation, compare to what you’ve done before using integrals and sums?
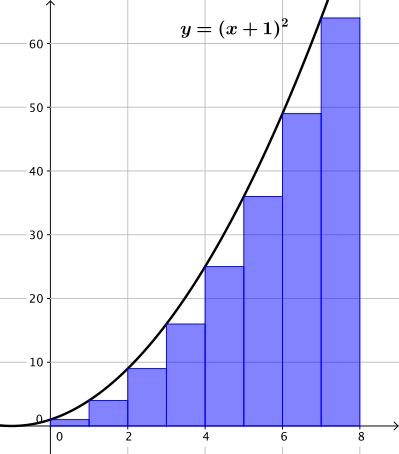
Can you find a function that bounds the graphical representation of on the other side?
Use this function to provide a second bound for .
Now we know that we are looking to find an upper bound. We can find a function that gives an overestimate of the area by using a transformation of .
Therefore the integral provides an upper bound to . It evaluates to , so we have the following bounds for :
Our result shows that . Does this seem reasonable? Why might we have expected this result?
There is more than one way we can approximate an upper bound for . A different approach involves the following diagram.
We can use this to write the inequality
If we add to both sides of the inequality we get
which can be simplified to
How does this compare to the upper bound found above? Does it matter that the limits are slightly different?
To find the exact value of you might like to try the review question R6143.