Sector spirals
Excerpt: Students are asked to calculate a selection of arc lengths and sector areas in a given diagram. They are also encouraged to think about how adaptations to the diagram affect these values and to think about the special case where arc length is equal to sector area.
Problem
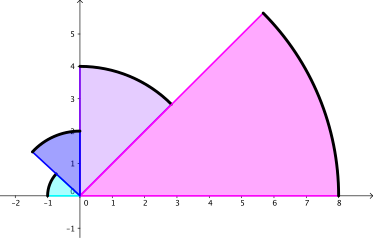
Describe this image to someone who cannot see it. What information do you need to provide in order for them to accurately reconstruct it?
Assuming the four sectors are of equal angle, calculate the arc length and area of each sector.
What do you notice?
What features of the original image are preserved if it is adapted to create each of these?
What can you say about the arc length and area of each sector in each case?
Things you might have noticed
In order to make our work clear let’s label the sectors 1 - 4 in a clockwise direction (from smallest to largest radius).
Some things to notice
-
Each sector has a central angle of (or radians) and therefore represents of its corresponding circle.
-
As all circles are mathematically similar, and the radius doubles as we move from sector 1 to sector 2 and so on, each sector is an enlargement of the previous one by length scale factor 2.
How can these ideas help us to complete the task?
Numerical solutions
| Sector | Arc length | Sector area |
|---|---|---|
| 1 | ||
| 2 | ||
| 3 | ||
| 4 |
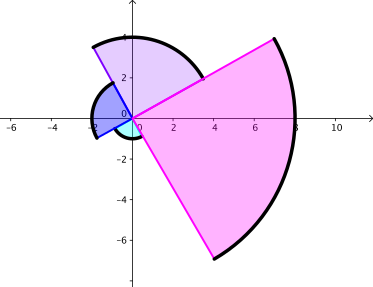
What features of the original image are preserved if it is adapted to look like this?
Some things that have stayed the same
-
There are four sectors, centred on the origin, that appear to be of equal angle.
-
The four sectors are of radius 1, 2, 4 and 8 respectively.
-
Starting with the smallest (light blue) sector, each sector is an enlargement of the previous one by length scale factor 2.
Some things that have changed
-
The four sectors now make a complete loop and so we can assume that each sector has an angle of (or radians) and therefore represents of its corresponding circle.
-
The values for arc length will be double those of the corresponding sectors in the original problem. What do you expect to happen to the areas of the corresponding sectors?
Numerical solutions
| Sector | Arc length | Sector area |
|---|---|---|
| 1 | ||
| 2 | ||
| 3 | ||
| 4 |
Some more things to notice
-
For sector 2 (of radius 2) the values for arc length and sector area are equal. This was also true for sector 2 in the original image.
-
For each sector, the ratio of arc length to sector area is preserved from the original image.
Do you expect these things to be true for the second adaptation of the image too?
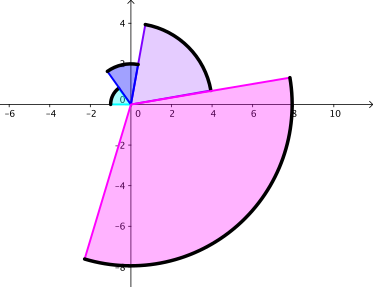
What features of the original image are preserved if it is adapted to look like this?
This image has been adapted differently. There are still four sectors, centred on the origin, of radius 1, 2, 4 and 8 respectively. However, they no longer appear to be of equal angle. It looks as though the sector angles may be increasing with sector radius but the exact values are unknown and this means that we cannot calculate arc length and sector area accurately for this diagram. So what can we say about the arc length and sector area in this case?
Perhaps if we think about some of the things that we noticed in the other two diagrams we might be able to decide if these still apply.
Why is it that for sector 2 the values of arc length and sector area are equal in the first two diagrams?
- Will those values be equal for sector 2 in this diagram?
What is the ratio of arc length to sector area for each sector in the previous two diagrams?
-
Could you have predicted this to be the case?
-
Can you say anything about these ratios in this diagram?