14 markseasy
2 marks
A meteorologist records the highest wind speed each day, in knots, at a weather station. The box-and-whisker plot shows the results for 15 days in June.
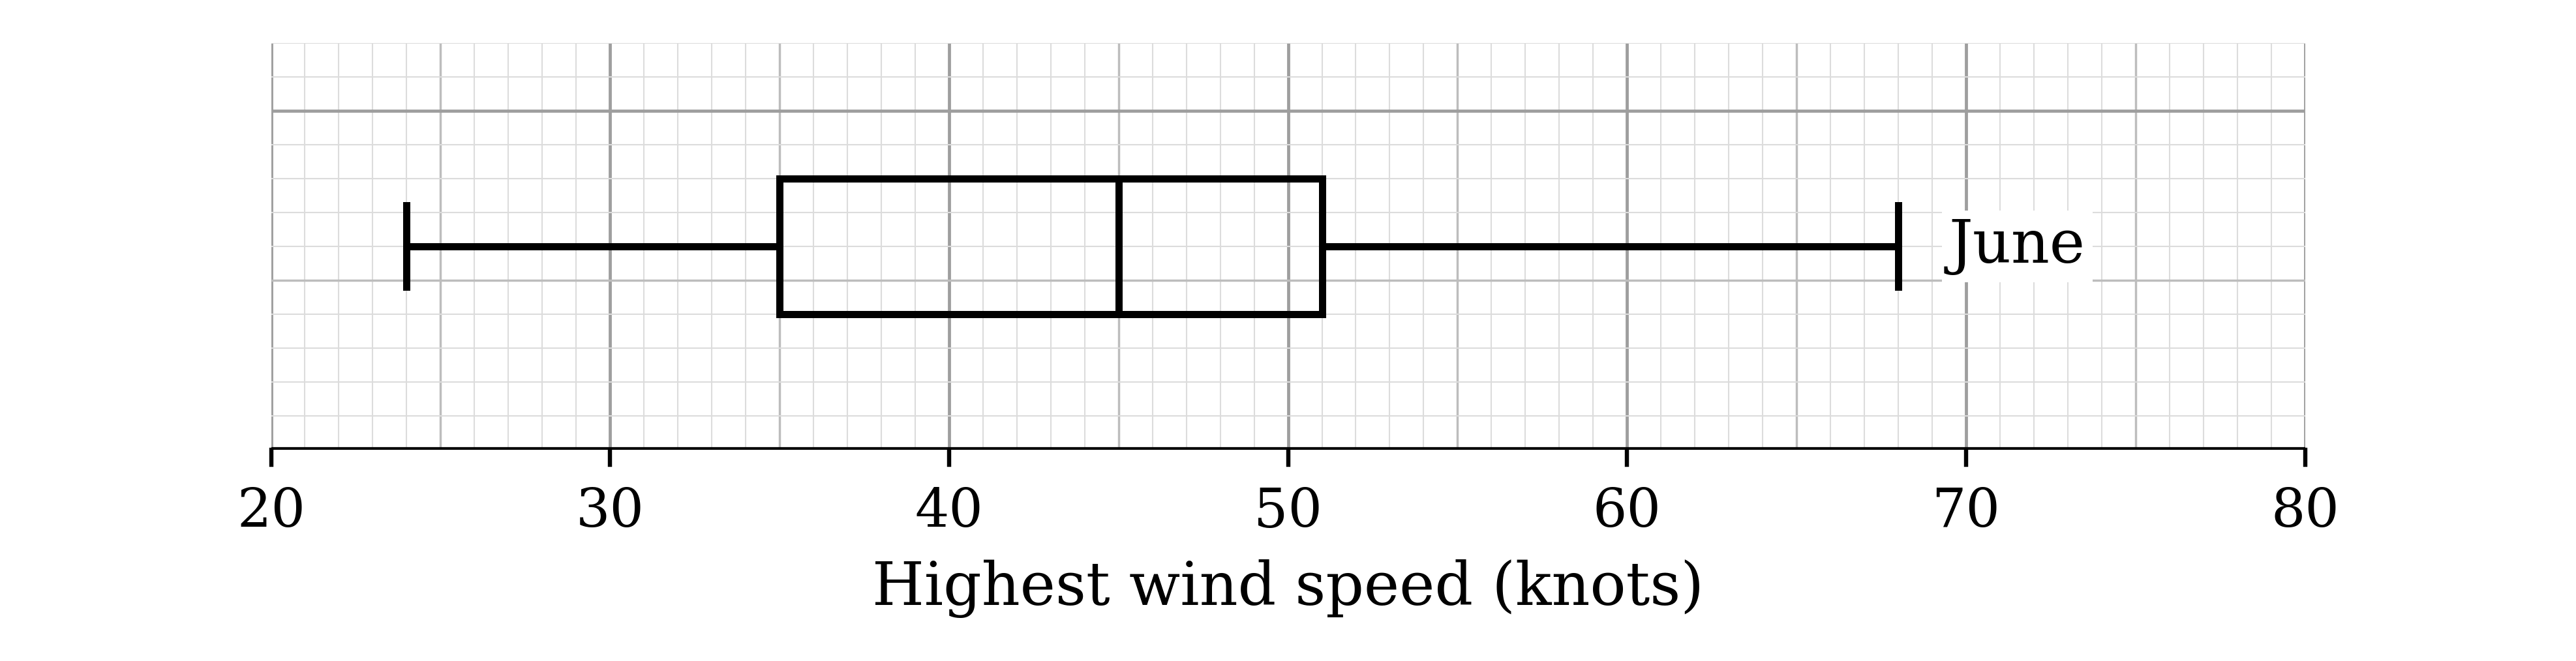
(i) Give one reason why a box-and-whisker plot is a suitable way to represent these data.
(ii) The highest wind speed recorded in June, 68 knots, is an extreme value. Give a reason why the median is likely to be more suitable than the mean as a measure of the average wind speed in June.
2 marks
The box-and-whisker plot for 15 days in July has been added to the same diagram.
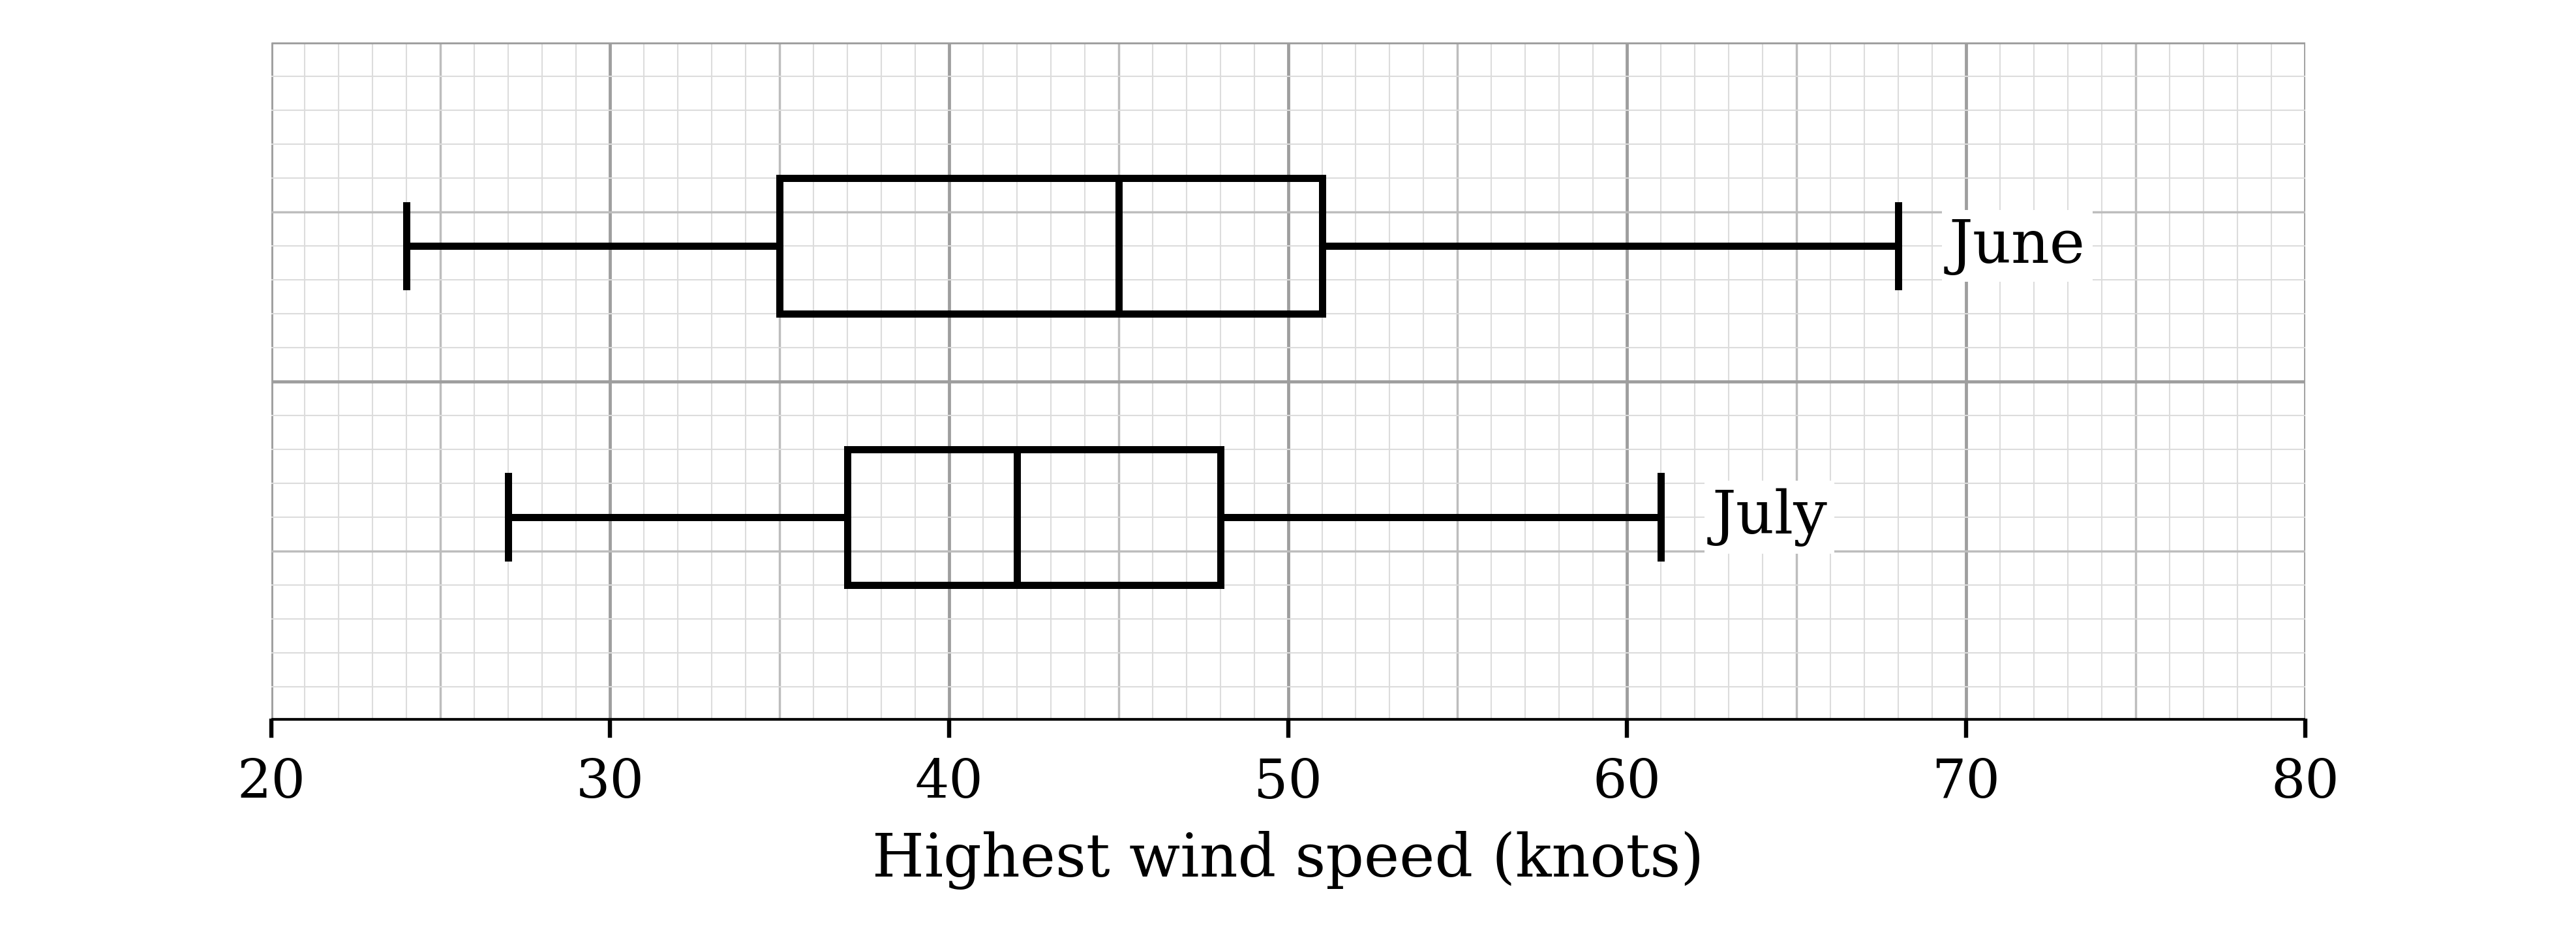
Make two comparisons between the highest wind speeds in June and the highest wind speeds in July.