Velocity-Time Graphs (Cambridge International A-Level Mathematics)
Velocity-time graphs
What is a velocity-time graph?
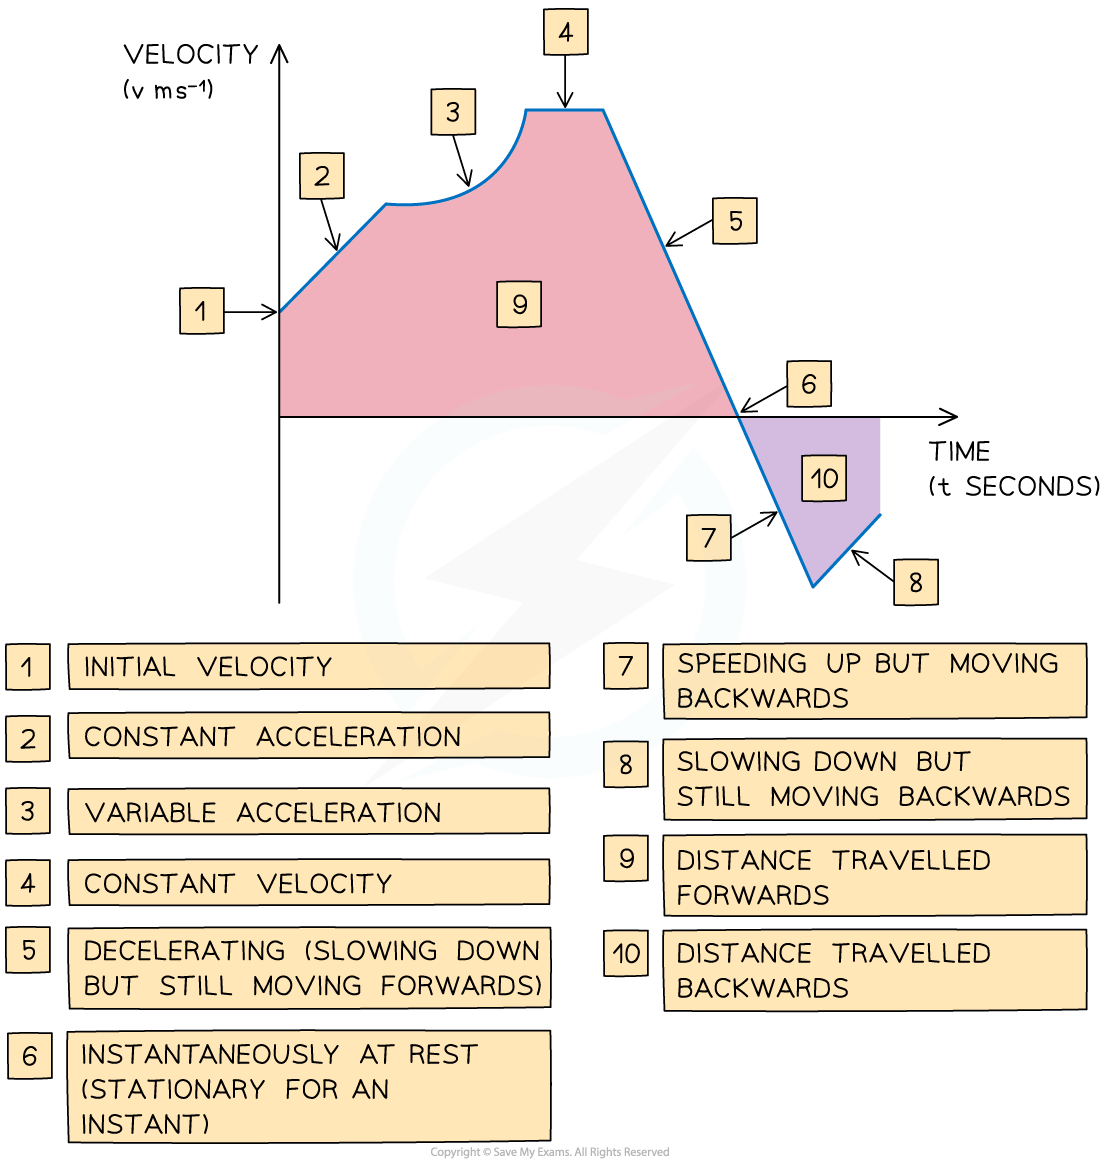
- Velocity- time graphs show the velocity of an object as it moves in a straight line
- They show velocity (on the vertical axis) against time (on the horizontal axis)
- Velocity-time graphs can go below the horizontal axis whereas speed-time graphs can not
What are the key features of a velocity-time graph?
-
The gradient of the graph equals the acceleration of an object
-
A straight line shows that the object is accelerating at a constant rate
-
A horizontal line shows that the object is moving at a constant velocity
-
The area between the graph and the x-axis tells us the change in displacement of the object
- Graph above the x-axis means the object is moving forwards
- Graph below the x-axis means the object is moving backwards
-
The **total displacement **of the object from its starting point is the sum of the areas above the x-axis minus the sum of the areas below the x-axis
-
The** total distance travelled **by the object is the sum of all the areas
-
If the graph touches the x-axis then the object is** stationary** at that time
-
If the graph is above the x-axis then the object has positive velocity and is travelling forwards
-
If the graph is below the x-axis then the object has negative velocity and is travelling backwards
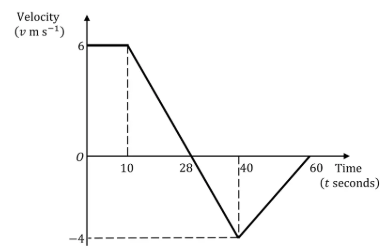
Worked Example The motion of a bird travelling in a straight line is tracked for 60 seconds.
This information is displayed in the velocity-time graph below.
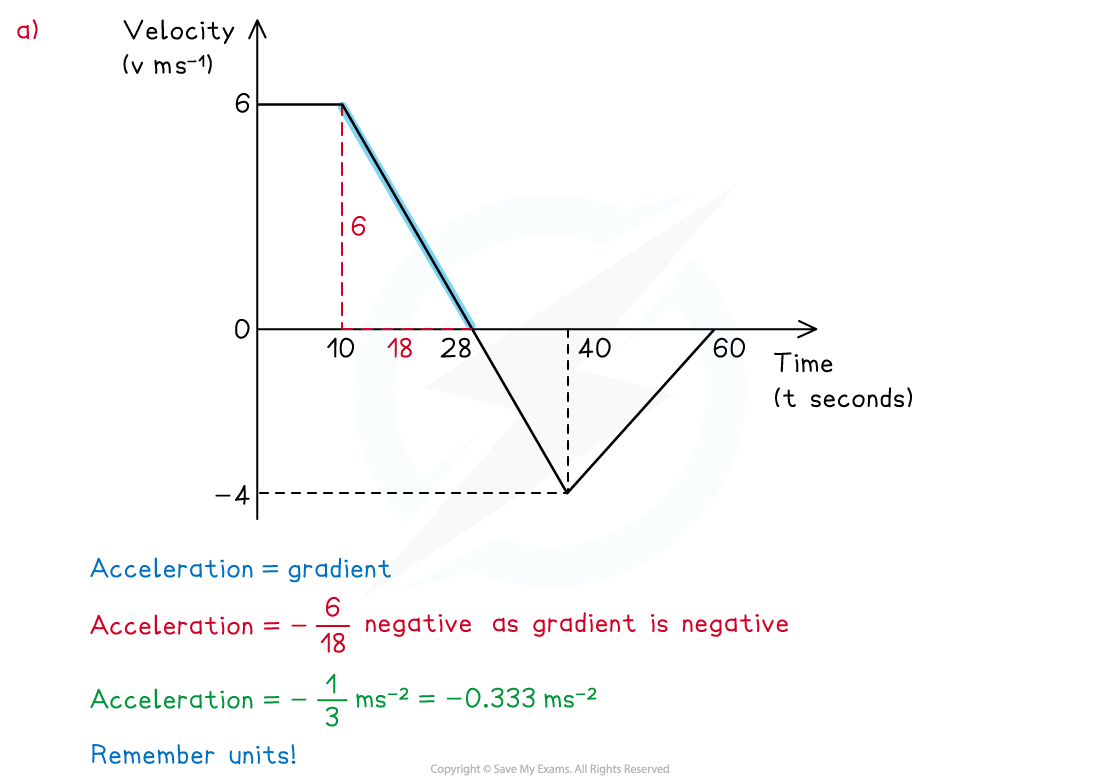
(a) Calculate the acceleration of the bird at 20 seconds.
Answer:
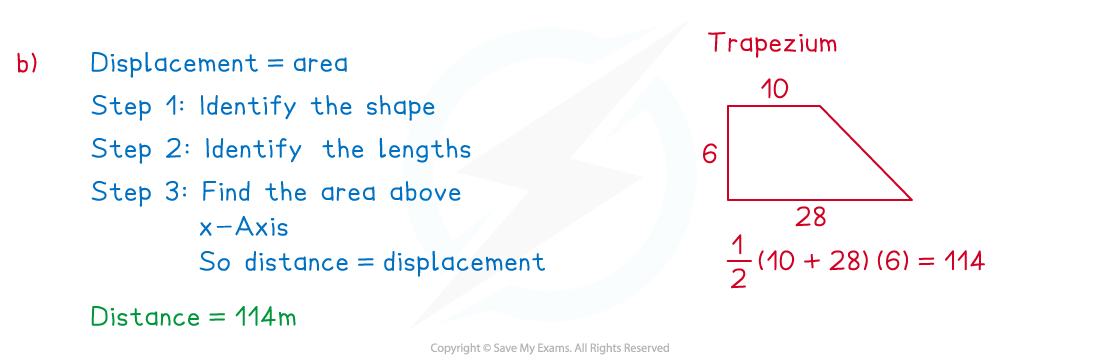
(b) Calculate the distance travelled in the first 28 seconds.
Answer:
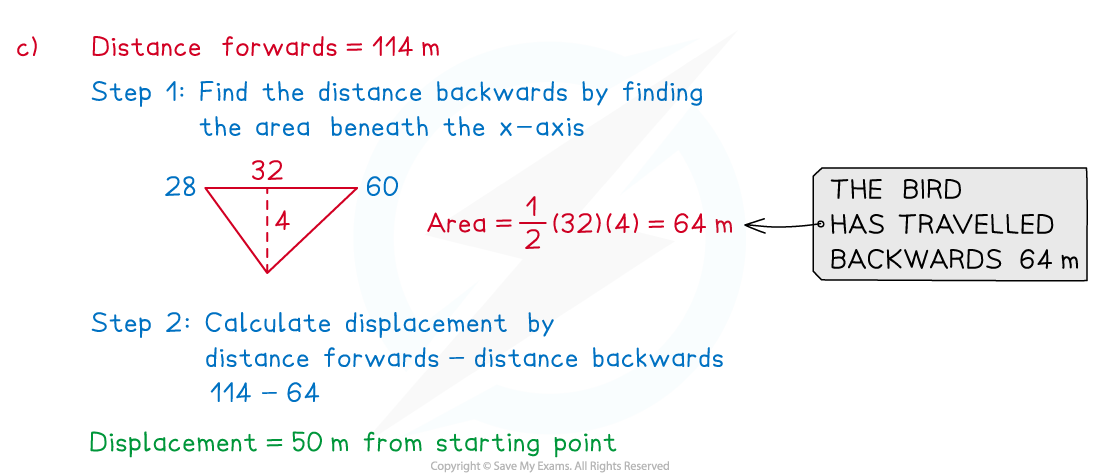
(c) Calculate the displacement of the bird from its starting point after 60 seconds.
Answer:
Exam Hint
- Be careful to spot if you are working with a distance-time graph or a velocity-time graph.
- Be careful to spot if you are working with a speed-time graph or a velocity-time graph.
- Check where the graph starts from on the y-axis, the velocity does not have to start at 0. For example, the scenario could be a car driving at a constant speed and the driver sees a hazard.
- Be extra vigilant when working with negative gradients or with graphs under the x-axis, it is easy to make mistakes with these.
- Speed is a scalar so it can not be negative whereas velocity can be. Make sure your units are consistent.
Was this revision note helpful?